Sep 17, 2020, 10:42:50 AM
WTI Crude Oil: technical analysis
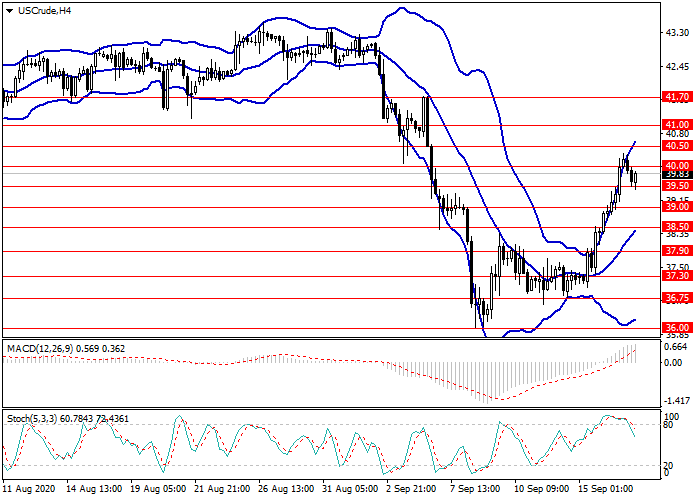
WTI Crude Oil, H4
An uptrend is forming on the H4 chart. The instrument is traded at the upper border of Bollinger Bands; the indicator cloud is expanded; the preservation of the uptrend is likely in the medium term. MACD histogram is in the positive zone gradually increasing volumes; the signal line is crossing the body of the histogram from below, forming a signal for opening buy orders. Stochastic crosses the oversold zone from above; a signal to open short positions is forming.
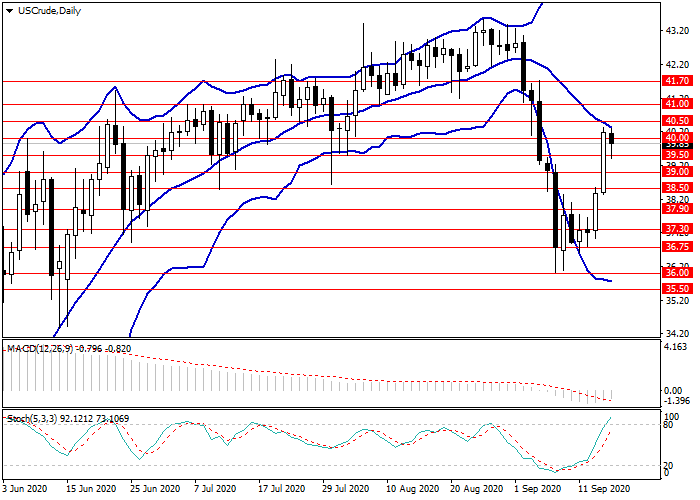
WTI Crude Oil, D1
On the daily chart, lateral trend formation is again observed. The instrument is consolidating at the center line of Bollinger Bands, the indicator cloud is narrowing. MACD histogram is near the zero level, its volumes are minimal; the signal line is directed horizontally without forming a clear signal to enter the market. Stochastic is in the neutral zone; the lines of the oscillator are directed upwards preparing to cross the overbought zone. The buy signal remains.
Key levels
Resistance levels: 40.00, 40.50, 41.00.
Support levels: 39.50, 39.00, 38.50, 37.90, 37.30, 36.75, 36.00.
Trading tips
Long positions may be opened from the level of 40.50 with target at 41.00 and stop-loss at 40.20.
Short positions may be opened from the level of 39.00 with target at 38.50. Stop-loss – 39.30.
Implementation time: 1-3 days.
Scenario
-
Timeframe
Intraday
-
Recommendation
BUY STOP
-
Entry Point
40.50
-
Take Profit
41.00
-
Stop Loss
40.20
-
Key Levels
36.00, 36.75, 37.30, 37.90, 38.50, 39.00, 39.50, 40.00, 40.50, 41.00
Alternative scenario
-
Timeframe
Intraday
-
Recommendation
SELL STOP
-
Entry Point
39.00
-
Take Profit
38.50
-
Stop Loss
39.30
-
Key Levels
36.00, 36.75, 37.30, 37.90, 38.50, 39.00, 39.50, 40.00, 40.50, 41.00