Sep 17, 2020, 7:41:40 AM
GBP/USD: wave analysis
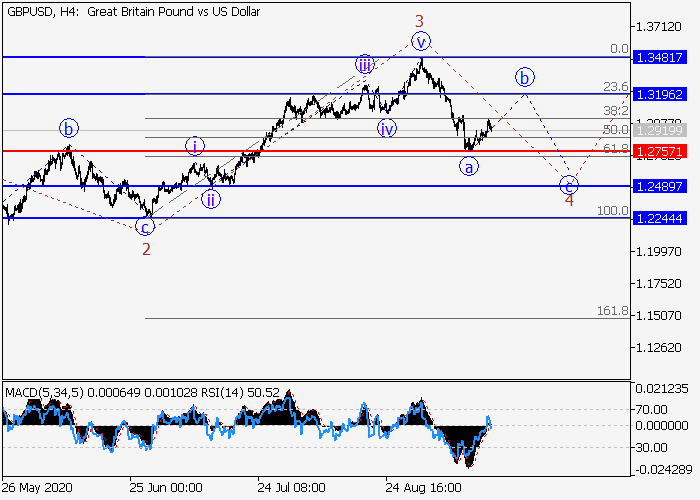
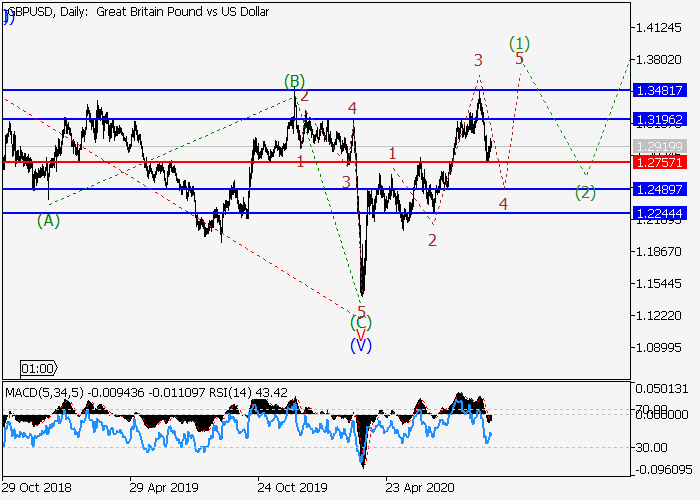
The pair is in a correction and may grow.
On the daily chart, the third wave of the higher level (3) develops, within which the wave 3 of (3) formed. Now, a local correction is developing as the fourth wave 4 of (3), within which the wave a of 4 has formed, and the wave b of 4 is developing. If the assumption is correct, the pair will grow to the levels of 1.3196–1.3481. In this scenario, critical stop loss level is 1.2757.
Main scenario
Long positions will become relevant above the level of 1.2757 with the targets at 1.3196–1.3481. Implementation period: 5–7 days.
Alternative scenario
The breakdown and the consolidation of the price below the level of 1.2757 will let the pair go down to the levels of 1.2489–1.2244.
Scenario
-
Timeframe
Weekly
-
Recommendation
BUY
-
Entry Point
1.2930
-
Take Profit
1.3196, 1.3481
-
Stop Loss
1.2757
-
Key Levels
1.2244, 1.2489, 1.2757, 1.3196, 1.3481
Alternative scenario
-
Timeframe
Weekly
-
Recommendation
SELL STOP
-
Entry Point
1.2750
-
Take Profit
1.2489, 1.2244
-
Stop Loss
1.2840
-
Key Levels
1.2244, 1.2489, 1.2757, 1.3196, 1.3481