Sep 15, 2020, 7:33:53 AM
USD/JPY: wave analysis
The pair may fall.
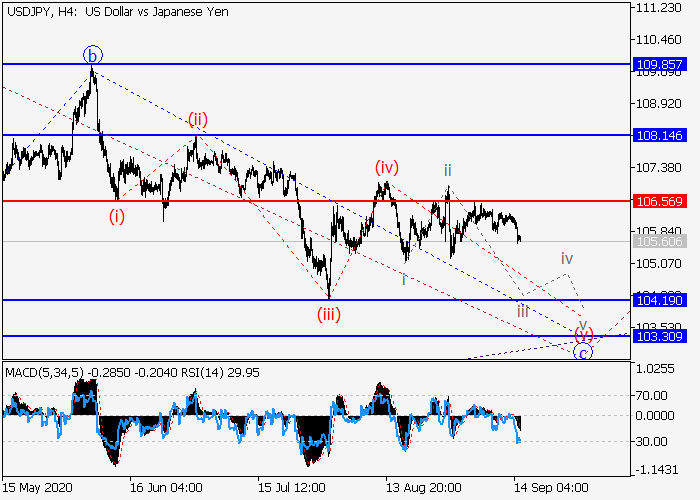
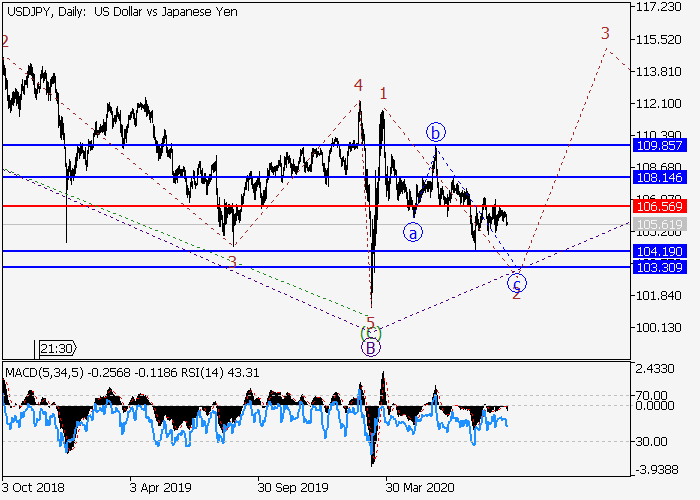
On the daily chart, a downward correction of the higher level develops as the wave 2, within which the wave c of 2 forms. Now, the fifth wave of the lower level (v) of c is developing, within which the wave ii of (v) has ended, and the wave iii of (v) is forming. If the assumption is correct, the pair will fall to the levels of 104.19–103.30. In this scenario, critical stop loss level is 106.56.
Main scenario
Short positions will become relevant during the correction, below the level of 106.56 with the targets at 104.19–103.30. Implementation period: 7 days and more.
Alternative scenario
The breakout and the consolidation of the price above the level of 106.56 will let the pair grow to the levels of 108.14–109.85.
Scenario
-
Timeframe
Weekly
-
Recommendation
SELL
-
Entry Point
105.64
-
Take Profit
104.19, 103.30
-
Stop Loss
106.56
-
Key Levels
103.30, 104.19, 106.56, 108.14, 109.85
Alternative scenario
-
Timeframe
Weekly
-
Recommendation
BUY STOP
-
Entry Point
106.60
-
Take Profit
108.14, 109.85
-
Stop Loss
106.00
-
Key Levels
103.30, 104.19, 106.56, 108.14, 109.85