Sep 16, 2020, 7:45:22 AM
JP Morgan Chase Co.: wave analysis
The price may fall.
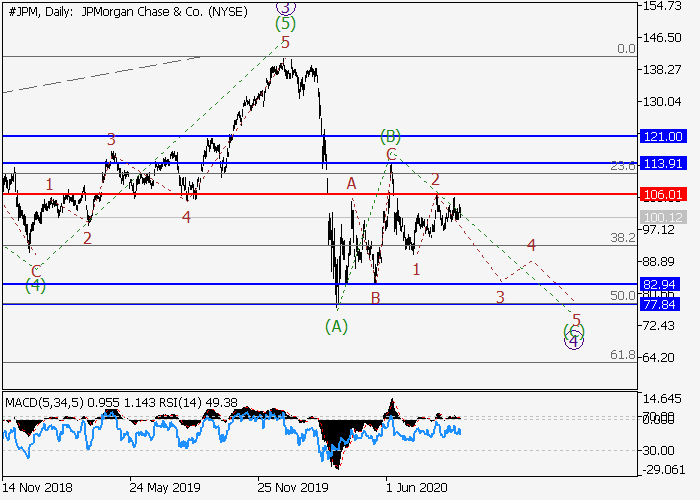
On the daily chart, a downward correction of the higher level develops as the fourth wave 4, within which the wave (C) of 4 forms. Now, the first wave of the lower level 1 of (C) has formed, and a local correction has ended as the wave 2 of (C). If the assumption is correct, the price will fall within the wave 3 of (C) to the levels of 82.94–77.84. In this scenario, critical stop loss level is 106.01.

Main scenario
Short positions will become relevant during the correction, below the level of 106.01 with the targets at 82.94–77.84. Implementation period: 7 days and more.
Alternative scenario
The breakout and the consolidation of the price above the level of 106.01 will let the price grow to the levels of 113.91–121.00.
Scenario
-
Timeframe
Weekly
-
Recommendation
SELL
-
Entry Point
99.23
-
Take Profit
82.94, 77.84
-
Stop Loss
106.01
-
Key Levels
77.84, 82.94, 106.01, 113.91, 121.00
Alternative scenario
-
Timeframe
Weekly
-
Recommendation
BUY STOP
-
Entry Point
106.05
-
Take Profit
113.91, 121.00
-
Stop Loss
103.40
-
Key Levels
77.84, 82.94, 106.01, 113.91, 121.00
