Sep 14, 2020, 7:46:07 AM
Apple Inc.: wave analysis
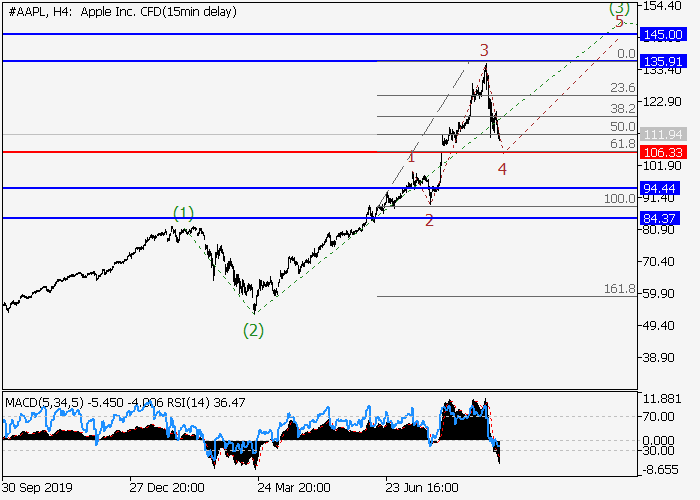
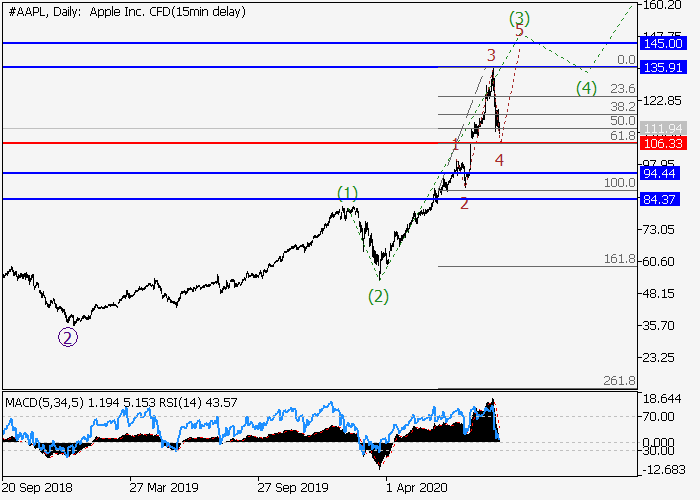
The price may grow.
On the daily chart, the third wave of the higher level 3 develops, within which the wave (3) of 3 forms. Now, a local correction is ending to develop as the fourth wave of the lower level 4 of (3). If the assumption is correct, after the end of the correction, the price will grow within the wave 5 of (3) to the levels of 135.91–145.00. In this scenario, critical stop loss level is 106.33.
Main scenario
Long positions will become relevant after the end of the correction, above the level of 106.33 with the targets at 135.91–145.00. Implementation period: 7 days and more.
Alternative scenario
The breakdown and the consolidation of the price below the level of 106.33 will let the price go down to the levels of 94.44–84.37.
Scenario
-
Timeframe
Weekly
-
Recommendation
BUY
-
Entry Point
112.31
-
Take Profit
135.91, 145.00
-
Stop Loss
106.33
-
Key Levels
84.37, 94.44, 106.33, 135.91, 145.00
Alternative scenario
-
Timeframe
Weekly
-
Recommendation
SELL STOP
-
Entry Point
106.30
-
Take Profit
94.44, 84.37
-
Stop Loss
110.25
-
Key Levels
84.37, 94.44, 106.33, 135.91, 145.00
