Sep 14, 2020, 8:20:14 AM
USD/JPY: flat dynamics
Current trend
USD is trading in different directions against JPY in today's Asian session, developing a flat channel that formed at the beginning of the month. The ambiguous macroeconomic statistics from the US on the dynamics of consumer inflation, published at the end of last week, did not provide significant support to USD, while JPY was expecting the publication of new drivers.
Today's macroeconomic statistics from Japan provide moderate support to JPY, as a result of which the pair is actively testing the level of 106.00 for a breakdown. Industrial production in July increased by 8.7% MoM, accelerating from the previous value of +8% MoM. In annual terms, the pace of production decreased by 15.5% YoY, which was slightly better than forecasts of –16.1% YoY. Capacity Utilization rose by 9.6% in July, after rising by 6.2% in June.
Support and resistance
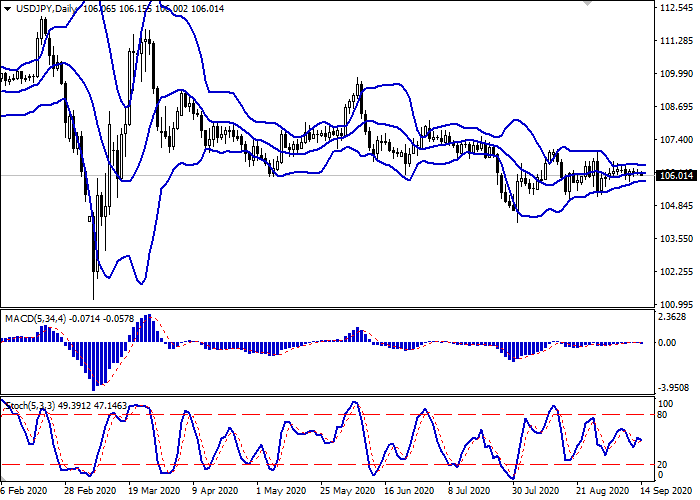
Bollinger Bands in D1 chart demonstrate steady flat dynamics. The price range remains virtually unchanged, indicating an approximate balance of power in the short term. The MACD indicator, which has not consolidated above the zero level, reverses downwards again, forming a sell signal (the histogram is below the signal line). Stochastic is showing unsteady dynamics and is located in the middle of its area.
One should wait for clarification of the situation at the market, as the current indicators remain uninformative.
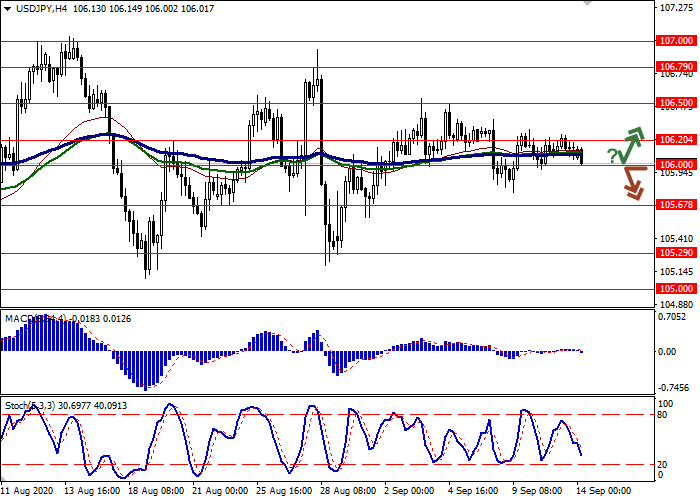
Resistance levels: 106.20, 106.50, 106.79, 107.00.
Support levels: 106.00, 105.67, 105.29, 105.00.
Trading tips
Short positions can be opened from the current levels with the nearest take-profit of 105.67. Stop-loss – 106.25.
To open long positions, one can rely on the rebound from the support level of 106.00 with the subsequent breakout of 106.20. Take-profit – 106.50. Stop-loss – 106.00.
Implementation time: 1-2 days.
Scenario
-
Timeframe
Intraday
-
Recommendation
SELL
-
Entry Point
106.05
-
Take Profit
105.67
-
Stop Loss
106.25
-
Key Levels
105.00, 105.29, 105.67, 106.00, 106.20, 106.50, 106.79, 107.00
Alternative scenario
-
Timeframe
Intraday
-
Recommendation
BUY STOP
-
Entry Point
106.25
-
Take Profit
106.50
-
Stop Loss
106.00
-
Key Levels
105.00, 105.29, 105.67, 106.00, 106.20, 106.50, 106.79, 107.00